Possibilities for investing in shares are almost endless. But how do you determine the value of a share? How do you decide whether it is cheap or expensive? The price-earnings ratio can be used to provide information.
Evaluating shares with the price-earnings ratio
The price-earnings ratio (PER) describes the relationship between a company’s earnings and its current share price. The price-earnings ratio examines the expected yield per share. The resulting value is one point of reference whether a share is cheap or expensive.
Example:
The companies Medtronic plc (2M6.DE) and Eli Lilly and Company (LLY.F) are active in the healthcare sector. They have a similar share price and a similar amount of shares in circulation:
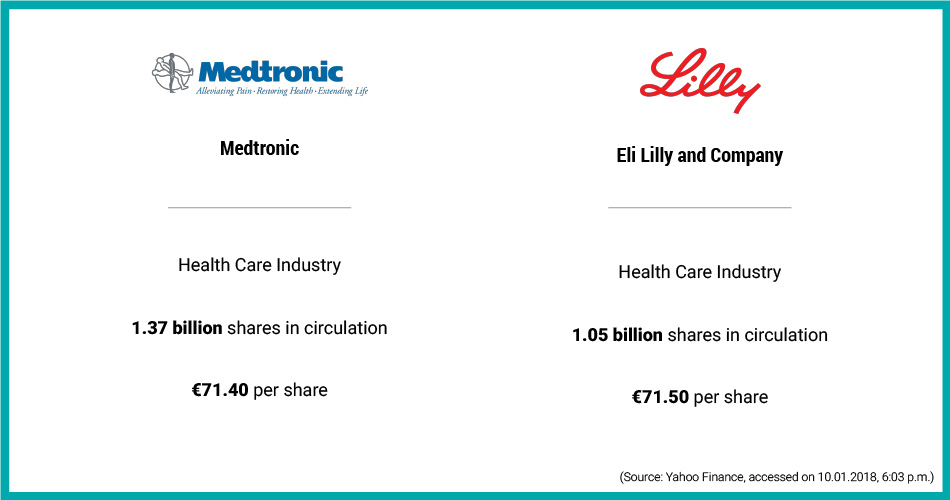
However, Medtronic’s PER is 19.64, while Eli Lilly and Company’s PER is 34.03. According to the PER, the Medtronic share is considerably cheaper than the other. The PER describes the factor by which the net profit per share determines the share price.
A PER of 19.64 expresses that the price of Medtronic is around twenty times more than the yield per share, which the company generates at this point in time. This, in turn, makes a statement concerning the valuation of the share: It is valued at twenty times the annual profit. It would take about 20 years for the company to earn the value of the shares through its profits.
Calculating the price-earnings ratio
To find the PER, one divides the share price by the company’s earnings per share. Therefore, the equation is:
PER = share price / earnings per share
PER = share price / (company earnings / amount of shares)
To stick with our example: If Medtronic’s share costs €71.40 and the company makes €3.63 per share, the PER is calculated as follows:
PER = € 71.40 / € 3.63 (earnings per share)
PER = 19.64
Portals like Yahoo Finance specify the PER so that you do not have to calculate it yourself. However, you should always pay attention to the earnings with which the calculation was made. It should always be carried out with the net profit, meaning after the deduction of interest, tax, and payments. The time at which the profit is calculated is also relevant. Are these figures from last year? In that case, the calculation is reliable but outdated. Are profit expectations based on future values? In that case, they might be too optimistic. Profits of the current fiscal year are ideally suitable. Yields from the previous quarters provide the best information.
Evaluating shares correctly: Interpreting the PER
The price-earnings ratio is only one key figure of one economic model to determine share values. –unfortunately, there is no general rule concerning the point at which the value of a share is overpriced. Furthermore, the PER differs within individual industries. Various sources provide a reference value between 12 and 15, along which equities can be measured: The share is generally considered favorable when below the reference value, whereas it is considered more expensive when above.
Financial journalist Gereon Kruse considers this rule of thumb to be more accurate: The PER may correspond approximately with the average growth rate of the company. Accordingly, if our example Medtronic increases its revenue by 20% from one fiscal year to the next, it’s PER of 20 is justified. The comparison of the PER with growth is called PEG – price earnings growth ratio.
Hint: If you look at the performance of a stock and notice strong fluctuations, it is advisable to calculate an average value. In this way, more reliable key figures can be generated and the fluctuations can be compared.
Generally speaking, a stock with a lower value is cheaper. However, financial expert Detlev Landmesser adds, stocks with a low PER can be a warning sign, for example, if a majority of investors expect a drop in profits and sell their stocks. This can be reflected in a low PER. In this case, a low PER would be an indicator of a rather unsuitable point in time.
At the same time, stocks with a high two-figure PER are not necessarily expensive if they are accompanied by appropriate revenue growth. Therefore:
Additional economic factors should always be taken into consideration when interpreting the PER.
For example, the history of profits can be important for estimating profit extrapolations. The company's balance sheet should also be consulted.
Economists always assume rational, all-knowing investors in their models. However, the reality is rather different. Political conditions and emotional behavior can turn every investment model upside down.
One example is the stock of Amazon.com Inc. (AMZN). One share today costs USD 1,276.68. The company earns USD 3.92 per share. This results in a PER of 325.52. Every economist would discourage investors from purchasing the stock at this point in time because it is very expensive. Yahoo lists Amazon’s PEG (price earnings growth ratio) at 17.48. Even Amazon’s growth does not justify the high PER. Still, the value of the stock is constantly growing. In the past 52 weeks, it grew by 50%. Investors count on Amazon’s future development and therefore purchase the stock, even if it cannot be justified from the perspective of financial theory, and definitely not with the PER.
Categorizing the price-earnings ratio
The PER is the most popular key indicator in fundamental analysis, which is used to evaluate stocks. One speaks of determining the “intrinsic value” of a share through fundamental analysis. It is generated by business data and the economic context of a company.
Next to the PER, it examines: The price-to-book ratio (P/BV), the total return on capital, the price-to-cash-flow ratio (P/CF), the price-to-sales ratio (PSR), the dividend yield, or the equity ratio. This gives the investor a target price. Investors who follow the concept of value investing are usually the ones carrying out fundamental analysis. In contrast to fundamental analysis, chart analysis is based on the valuation of stock market prices and patterns.
Fundamental analysis can also compare companies of different sizes. For this purpose, the quarterly or annual reports of the companies are used and compared. For the key figure dividend yield, for example, the yield distributed is related to the share price. The higher the dividend yield, the better the investment for the investor.
You can find all the elements of fundamental analysis in our article "Value Investing in Stocks."
Status as of 12.01.2018 06:39
Current investment opportunities

Would you also like to invest in innovative companies?


_315_209.jpg "Beteiligungsvertrag für Investoren einfach erklärt | Companisto")

Comments
Only registered Companists can comment. Please log in to leave a comment.